All of us, in the SaaS GTM org, have felt the drag of “broken data,” even if we don’t call it that. We know it exists and we plan to solve it ‘at a later date’. It doesn’t usually appear as a single catastrophic error. Instead, it creeps in as small inconsistencies, blank fields, and mismatched definitions. The slow leak that compounds into wasted time and erodes trust across the ‘data-backed’ decisions, we believe we are taking.
Why is it so common? Why data breaks down
Broken data doesn’t just happen by accident. It comes from how GTM systems grow over time; new tools get added quickly, teams create their own ways of working, and standards aren’t enforced. What looks like a messy report today is really the result of deeper cracks that formed in the foundation over months, and at times, years.
Each tool in your GTM stack was designed for a specific function. Salesforce tracks deals. HubSpot nurtures leads. Mixpanel captures usage. But they all define key fields differently. “Lifecycle stage” in HubSpot might be “lead status” in Salesforce. Worse, the same company might appear with three different IDs.
This creates what I call “schema chaos” where every system speaks its own dialect of the same language. And because no one wants to be wrong in front of the exec team, ops leaders become overly cautious, delaying reports just to make sure the numbers hold up.
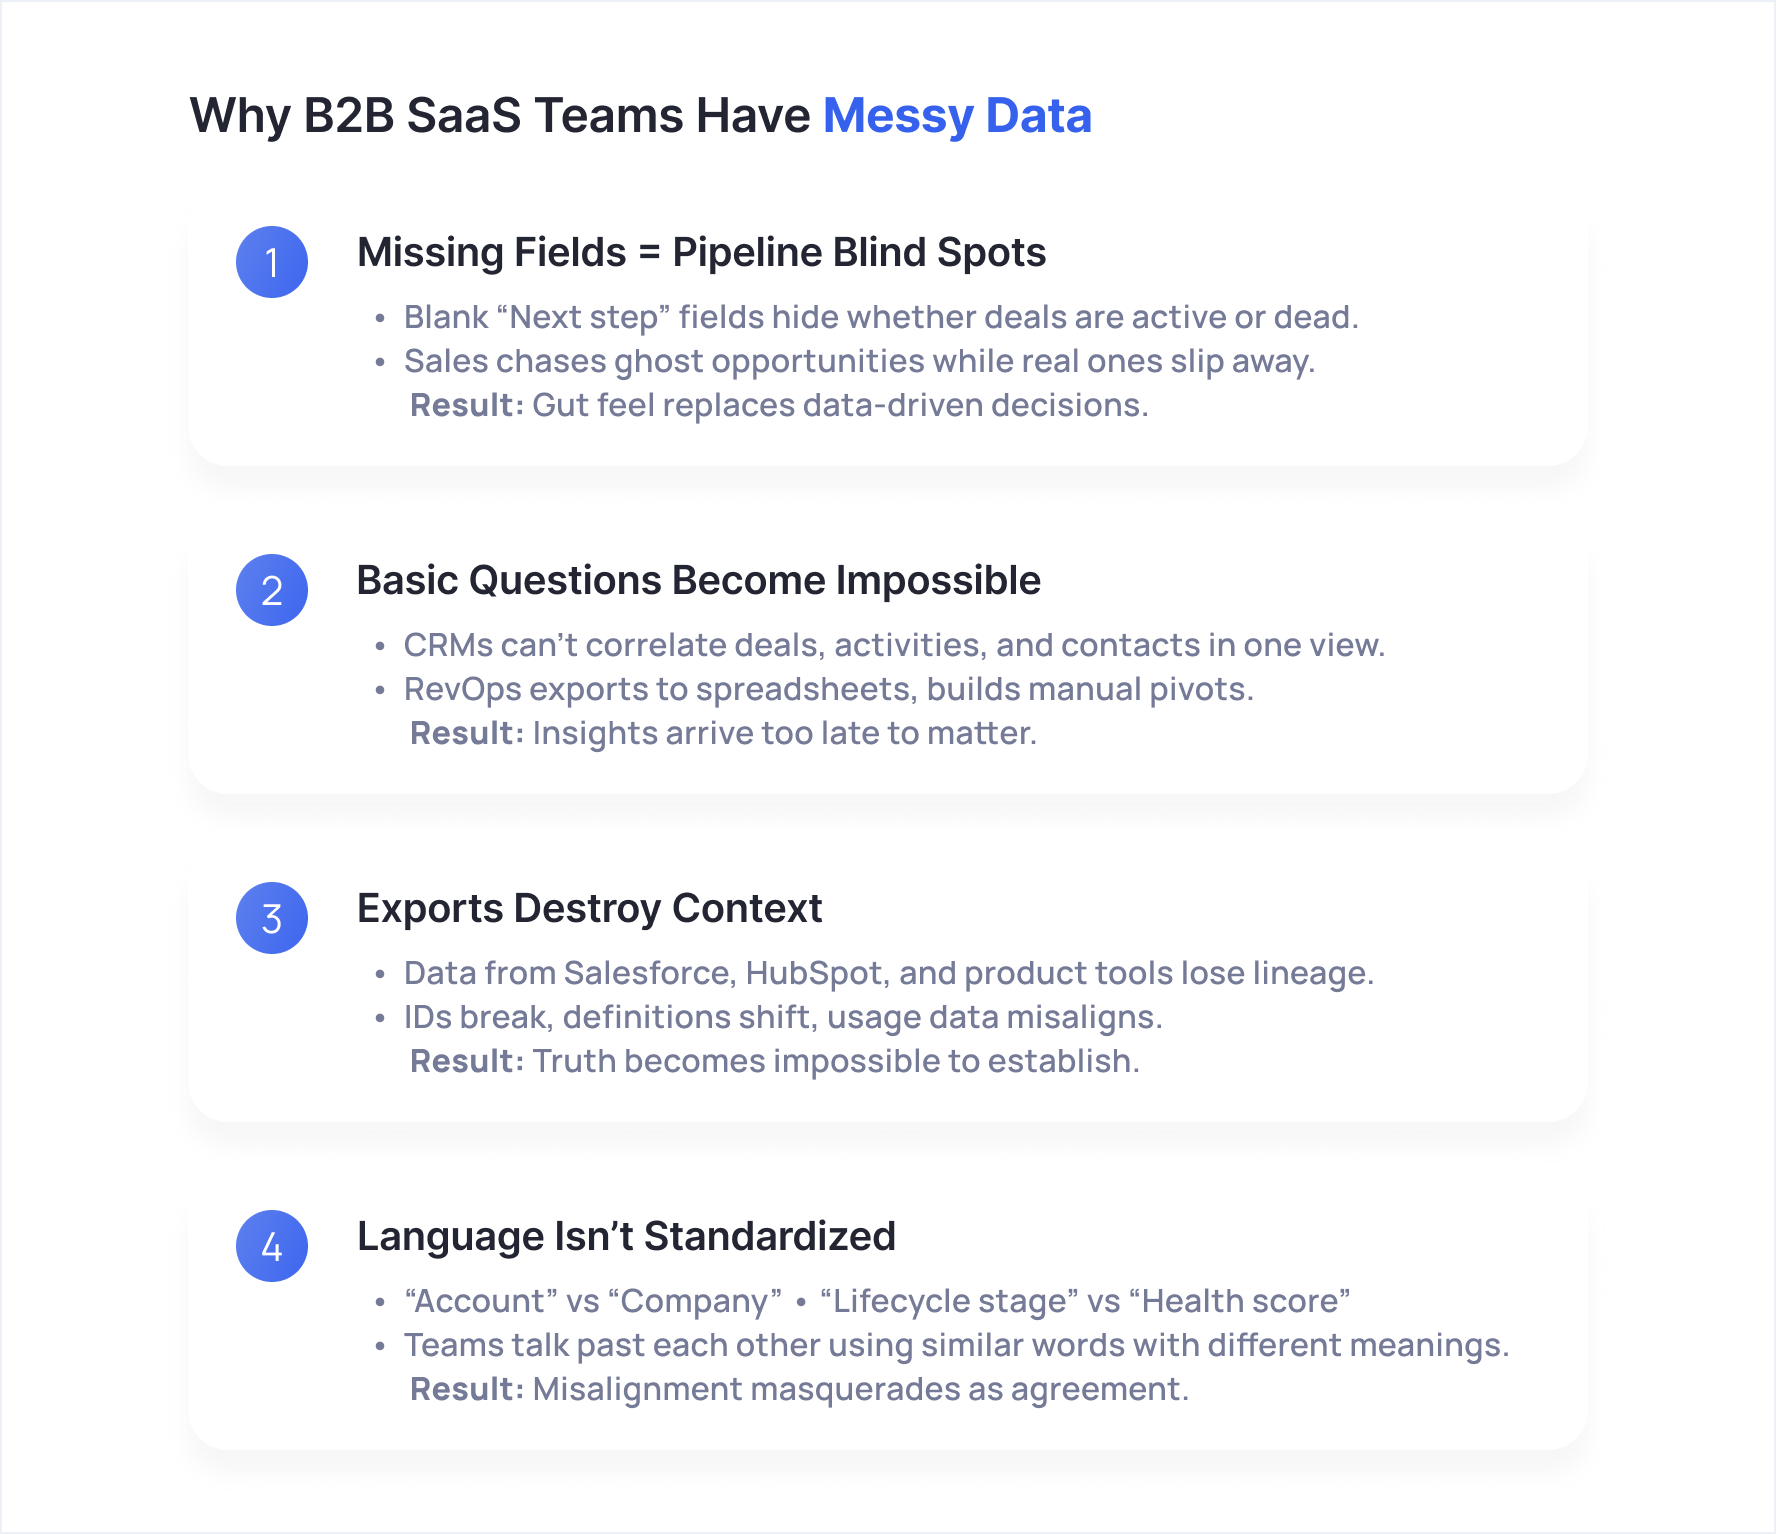
The most common reasons why B2B SaaS teams have messy data
Missing Fields Create Pipeline Blind Spots
A missing field can kill momentum. Take the “Next step” field in your CRM. If it’s blank, you have no way to tell whether the rep is actively working the deal or if it’s been parked in the pipeline.
Multiply that by dozens or hundreds of opportunities, and suddenly “stuck pipeline” is an invisible drag on revenue. Sales ends up diagnosing by gut feel instead of data, chasing deals that were dead weeks ago while ignoring the ones that still had life.
Basic Questions Become Impossible to Answer
On the surface, a question like “Do deals with no last activity convert worse?” sounds straightforward. In practice, CRMs aren’t designed to correlate across objects like deals, activities, and contacts in one clean view.
RevOps exports everything into spreadsheets, cobbles together pivots, and maybe lands on an answer. But by then, the sales cycle has already moved on. What could have been a crisp, real-time insight becomes a dusty artifact that no one trusts enough to act on.
Exports Destroy Context and Lineage
The moment data leaves its native system, it loses lineage. A Salesforce pipeline report, a HubSpot activity export, and a product-usage extract all look fine in isolation. But once those slices land in Google Sheets, context evaporates: unique IDs do not transcend, definitions change, and usage data gets misaligned.
Language Isn’t Standardized
Even when the numbers themselves are accurate, the words behind them aren’t. Sales may call it an “account,” while marketing calls it a “company.” One team measures “lifecycle stage,” another prefers “health score.” On paper, these sound interchangeable. In reality, they mask subtle differences that drive misalignment.
The cost of Messy Data in the AI Era
AI isn’t optional anymore and it’s becoming embedded in every GTM system. That means your data needs to be fast, clean, and reliable. If your foundation is shaky, AI will amplify the chaos rather than correct it.
AI models learn from patterns. If you feed them duplicates, missing fields, or conflicting records, the errors get baked in. As the saying goes: “garbage in, garbage out” still holds. When input data is flawed, AI outputs are flawed.
AI performance gains plateau or decline when cleaning is neglected. In fact, data scientists often spend the majority of their time just preparing data.
The Shift in Mindset in using AI for Data Diagnostics
Imagine an assistant that flags where lifecycle-stage values are missing, identifies fields with inconsistent formats, or surfaces stale attribution data. Instead of chasing insights, you ask: “Where is my data leaking?” and get actionable answers.
There’s a growing interest in the data analyst community using ML to repair data: anomaly detection, entity matching, imputing missing values—all ways that AI can help clean data.
If your ops team still spends five days stitching together a funnel view, you won’t win at speed. But if AI can pinpoint gaps in real time and propose fixes, that builds trust—and then the predictions start to mean something.
When cleaning becomes automated and diagnostic, AI stops being a fragile tool and becomes a partner in maintaining clarity, consistency, and confidence across GTM systems.
4-Week Data Audit and Assessment Plan (with ChatGPT)
Step 1: Run a Data Assessment (1–2 Weeks)
Start by profiling your core CRM objects: accounts, contacts, and deals. Use simple exports or prompt tools like ChatGPT to scan for missing fields, duplicate records, or inconsistent values.
Focus on the fields that matter for pipeline hygiene: owners, stages, next steps, and activity timestamps. If those are broken, forecasts won’t hold.
At the same time, align on vocabulary. “Accounts” in Salesforce and “Companies” in HubSpot should mean the same thing in every query, SQL join, or AI prompt. Document these decisions early to avoid endless rework later.
Using ChatGPT for Data Assessment:
- Paste CSV exports of accounts/contacts/deals and ask ChatGPT to “summarize missing owners, duplicates, and invalid stage values.”
- Prompt: “Highlight any accounts missing an owner, or deals with invalid stage names in this export.”
- Feed sample schemas and ask ChatGPT: “Normalize terminology between Salesforce Accounts and HubSpot Companies so I can standardize naming across SQL joins.”
Step 2: Document KPI Definitions and Audit Trails
Define how you calculate pipeline value, average deal cycle, and days in stage. Then write it down. If someone challenges the numbers in a board deck, you should be able to point to the source logic.
Even a lightweight doc or Confluence page beats tribal knowledge. AI tools can help by suggesting draft definitions or flagging when two reports use different formulas.
Using ChatGPT:
- Provide metric formulas and ask: “Write standardized KPI definitions with assumptions and caveats in Confluence-ready format.”
- Paste multiple SQL queries or report definitions and prompt: “Identify differences between how pipeline value is calculated in these queries.”
- Use ChatGPT to generate version-controlled documentation: “Turn these pipeline metric definitions into a glossary with one-line summaries and longer explanations.”
Step 3: Unify and Reconcile the Minimum Viable Data
Don’t try to boil the ocean. Start by connecting CRM, marketing automation, and product usage. These three systems answer 80% of the recurring revenue questions.
Avoid patching gaps with spreadsheets; context and lineage vanish the moment you do. Instead, stage multi-table joins that cover your must-have questions, like:
- Do deals with no recent activity convert worse?
- Does CSM activity increase expansion rates?
Even ChatGPT or Claude can generate starter SQL for these joins if you describe the schema.
Using ChatGPT or Claude to generate the schema:
- Paste table schemas (CRM, marketing, product usage) and ask: “Write SQL to join these three tables on account_id to analyze whether deal inactivity predicts lower conversion.”
- Prompt the AI to generate starter dbt models: “Draft a dbt model for unifying deals, contacts, and product events into one analytics-ready table.”
- Ask ChatGPT to flag reconciliation gaps: “Compare these two data extracts and list mismatches in account IDs or inconsistent field naming.”
Step 4: Enforce Standardized KPIs and Hygiene Checks
Turn your definitions into rules. For example, require a “Next step” on all deals closing within 30–60 days. Monitor deals stuck in stage too long and flag them as at risk.
You don’t need fancy software at first. AI assistants can run weekly prompts on exports to surface anomalies like missing owners, mismatched lifecycle stages, or stale MQLs. Keep the outputs tied to audit trails so fixes are trackable.
How to use ChatGPT here:
- Upload weekly CRM exports and ask: “List deals closing this quarter that are missing a next step.”
- Prompt: “Highlight all MQLs older than 60 days with no activity.”
- Ask ChatGPT to draft Slack alerts or email templates summarizing hygiene issues for AEs/CSMs.
- Use it to generate audit trail logs: “Turn this list of flagged records into a structured table with issue type, record ID, and timestamp.”
Step 5: Shift from Ad Hoc Analysis to Recurring Decision Cycles
The real payoff comes when you stop reinventing reports every week.
Come prepared not just with metrics, but with actions. Which deals need a next step? Which cohorts show churn risk? Which campaigns deserve more budget? Push those next-best actions to owners AEs, CSMs, or marketers, and close the loop.
How Petavue enables Data Assessment in minutes
1. Unified Ingestion & Data Cleansing
Petavue starts by connecting directly to your CRM, marketing automation, product analytics, and CX systems — no custom ETL jobs or months of modeling required. Once connected, it immediately begins scanning for hygiene gaps: missing values in key fields, fuzzy or duplicate names, broken UTM parameters, orphaned contacts. Instead of dumping these back into a spreadsheet for you to clean, Petavue either enriches them or flags them for quick resolution.
.gif)
Your business definitions aren’t overwritten, they’re enforced. Whether “ARR” or “pipeline value,” the terms your team already trusts become the canonical definitions that every system references, ensuring KPIs are finally consistent across reports, prompts, and dashboards.

2. Smart Prompts with Built-in GTM Context
Once your data is unified, the real power comes alive in Petavue’s prompt library. Think of it as your preloaded playbook for data assessment; hundreds of ready-to-run queries built specifically for the messy realities of GTM teams.
These aren’t generic AI prompts that leave you piecing together fragments of SQL. They’re designed in the language of RevOps, marketing ops, sales ops, and CS leaders.
For example:
- “Audit all Opportunities and show me the % with missing Close Dates, stuck in the same stage for more than 120 days, or missing buying role fields.”
- “Audit Customer Success data and highlight incomplete health scores, inconsistent renewal dates, and accounts with no linked primary contact.”
Each audit doesn’t stop at surfacing problems; it delivers recommended next steps you can act on right away. That might mean proposing new validation rules in Salesforce, nudging owners with a Slack alert, or flagging recurring errors for your admins to automate away.
3. Custom Audits, Real-Time & Traceable
Every company’s data mess looks a little different, and Petavue was built with that reality in mind. Beyond the prebuilt audits in the prompt library, you can spin up custom audits in minutes — no tickets, no waiting for analysts to free up capacity.
For sales opportunities, that might mean running hygiene checks such as:
- What % of deals have a valid source attribution tied back to campaign data?
- How many opportunities are missing a Close Date entirely?
- Which deals have been parked in the same stage for 90+ days with no forward motion?
- What portion of the pipeline has no decision-maker or buying role linked to the record?
For Customer Success, you can run real-time audits across contract dates, health scores, usage data, or renewal fields to check for completeness, normalization, and accuracy.
And every Petavue audit is fully traceable. Definitions, data lineage, and logic steps are laid out in plain English, so stakeholders see exactly how numbers were derived.
When your VP of Sales or CFO inevitably asks, “Where did this number come from?” You can point to a clear audit trail and say: “Here’s the source, here’s the rule, and here’s how the system validated it.”
And behind it all sits enterprise-grade governance: role-based access controls, encryption, audit logs, and full lineage tracking. Leaders get not only speed and visibility but also the compliance and traceability required to stand up in front of a board or pass a security review without breaking a sweat.
5. Role-Tailored Benefits
Every GTM function feels the drag of messy data differently. Petavue was designed to meet each role where it hurts most—then turn those pain points into fast, credible wins.
- RevOps / Sales Ops: For ops leaders, consistency is everything. Petavue enforces standardized KPI definitions across systems so you never have to explain why “pipeline value” means one thing in Salesforce and another in HubSpot. It continuously monitors pipeline hygiene, flags stalled deals, and highlights missing buying roles all with a clear audit trail. The result is cleaner forecasts, faster QBR prep, and the ability to coach reps with data, not hunches.
- Marketing Ops: Attribution breaks easily, and fixing it downstream can take days. With Petavue, marketing ops teams can pre-validate UTMs, campaign attribution, and lead hygiene before a campaign goes live. That means spend is tracked correctly from day one, MQL velocity can be trusted, and board slides stop being a painful debate over “which number is right.”
- Customer Success / CS Ops: CS leaders depend on complete, accurate customer data to manage renewals and expansions. Petavue runs ongoing audits across usage rollups, health scores, and contract data—catching orphaned accounts, missing renewal dates, or inconsistent scoring logic before they lead to blind spots. That means churn risk can be surfaced early, and expansion opportunities are identified with confidence.
- Agencies / Consulting Partners: For agencies and consultants, speed and repeatability are the differentiators. Petavue makes it possible to deliver hygiene audits as a packaged service—fast, explainable, and tailored to each client’s stack. Instead of weeks of manual reconciliation, you can show clients a clear report of where their data breaks and how to fix it, instantly demonstrating value.
At every level, the outcome is the same: what once took weeks of reconciling spreadsheets now takes minutes. Petavue gives GTM teams clean, explainable insights they can trust and the freedom to spend their time acting on opportunities, not untangling data knots.
Broken data isn’t just a nuisance, it’s a barrier
The messy realities of GTM data aren’t going away on their own. Left unchecked, broken fields, mismatched definitions, and exports that strip context become more than operational headaches. They erode trust, slow decisions, and cap growth.
In the AI era, the stakes are even higher. When the inputs are flawed, predictions collapse, and what looks like a “data-driven” strategy becomes guesswork dressed up in dashboards.
But this isn’t an unsolvable problem. Modern RevOps leaders are shifting their mindset: treating data health as a core workflow, not a quarterly clean-up project. AI can help diagnose gaps, enforce hygiene rules, and keep metrics standardized across every system.
That’s exactly where Petavue fits in. Instead of spending five days reconciling spreadsheets, teams run live audits in minutes. Instead of debating definitions, they enforce a single playbook. And instead of hoping AI models “figure it out,” they start with data that’s complete, explainable, and trusted.
Broken data may be today’s reality but with the right platform, it doesn’t have to be tomorrow’s.