


DATA UNIFICATION
All your GTM data, connected and understood.
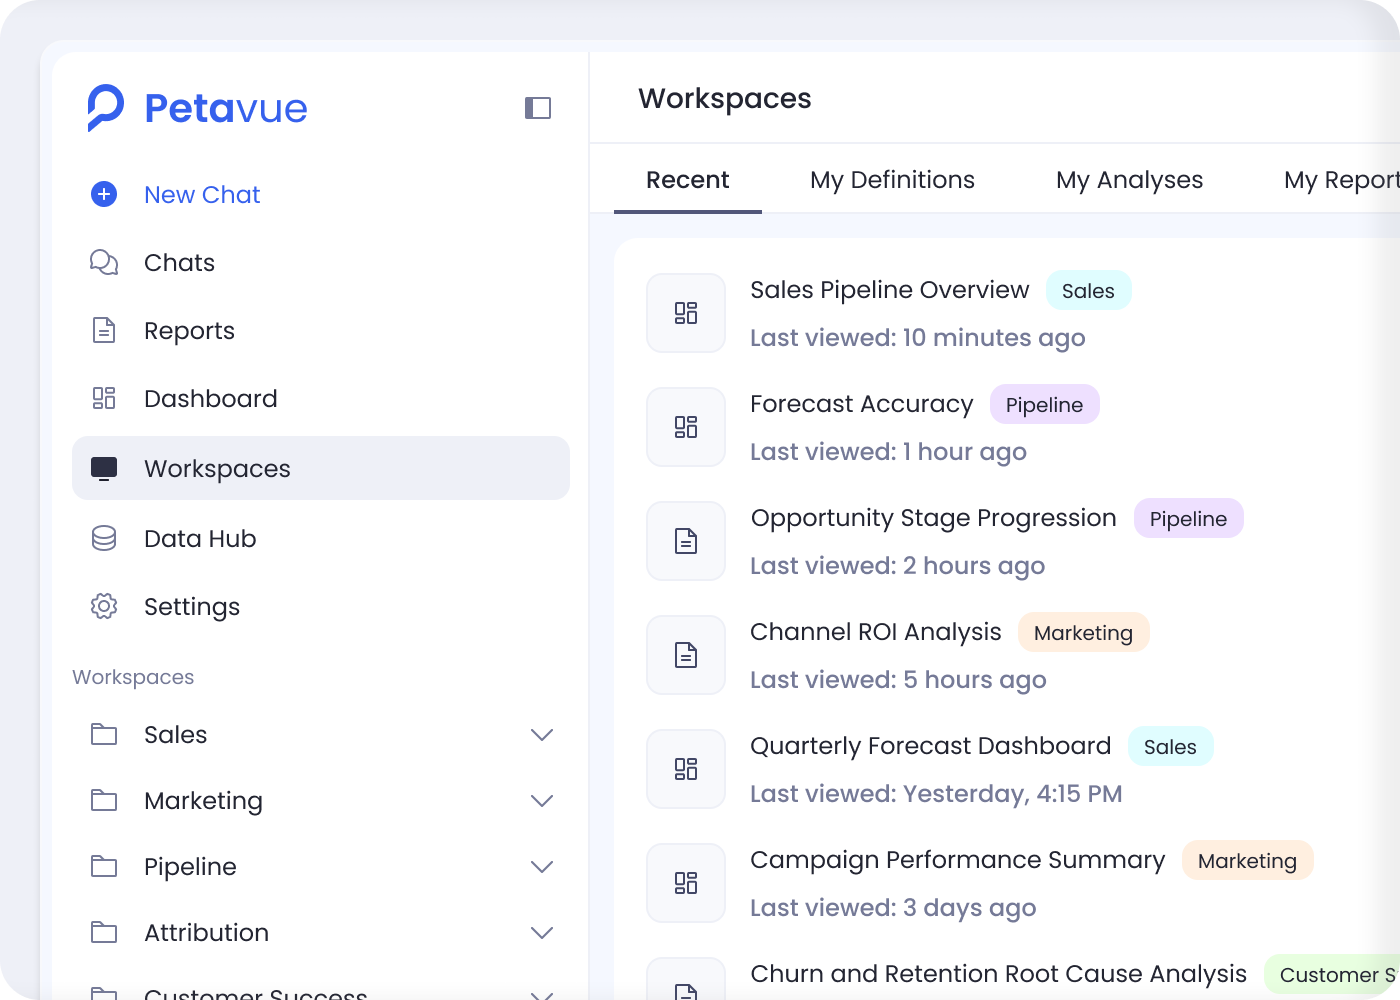
Petavue connects directly to your tools across Sales, Product, Finance, Marketing, Support, and more, unifying data for cross-system analysis.
It builds a semantic understanding of every source and auto-connects the data, so users spend less time prepping and more time analyzing.


.svg)
